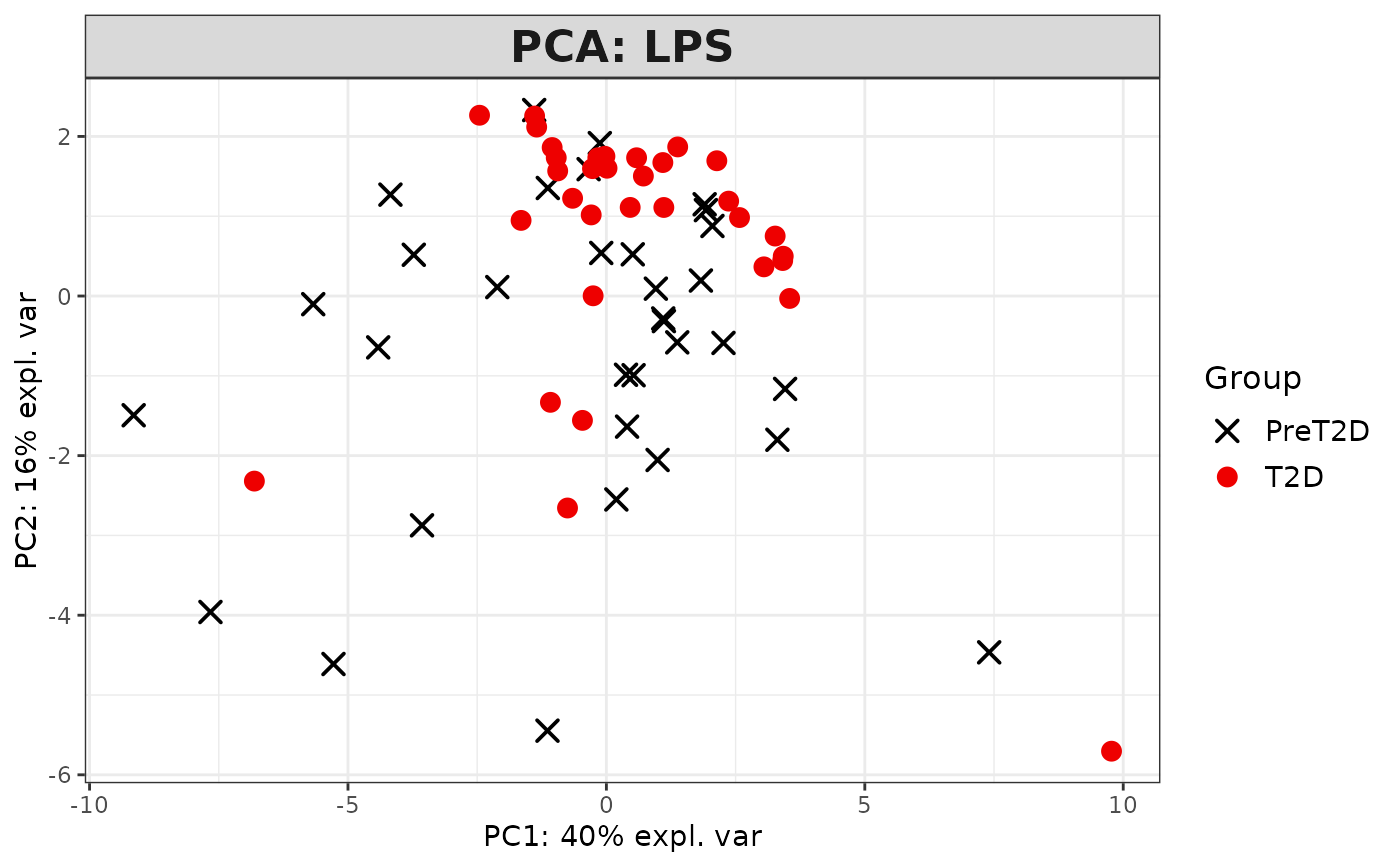
This function performs Principal Component Analysis (PCA) on cytokine data and generates several types of plots, including:
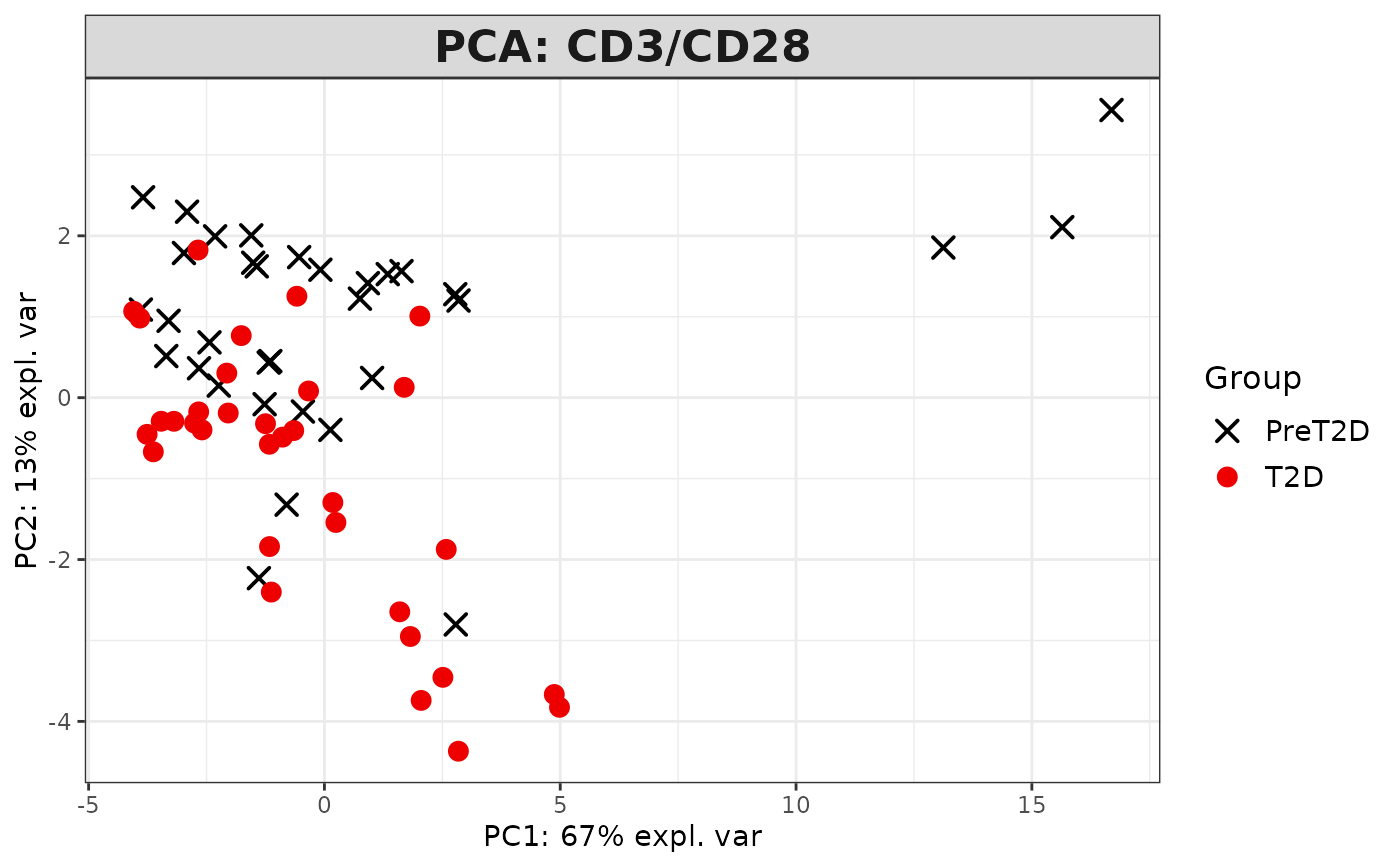
2D PCA plots using mixOmics'
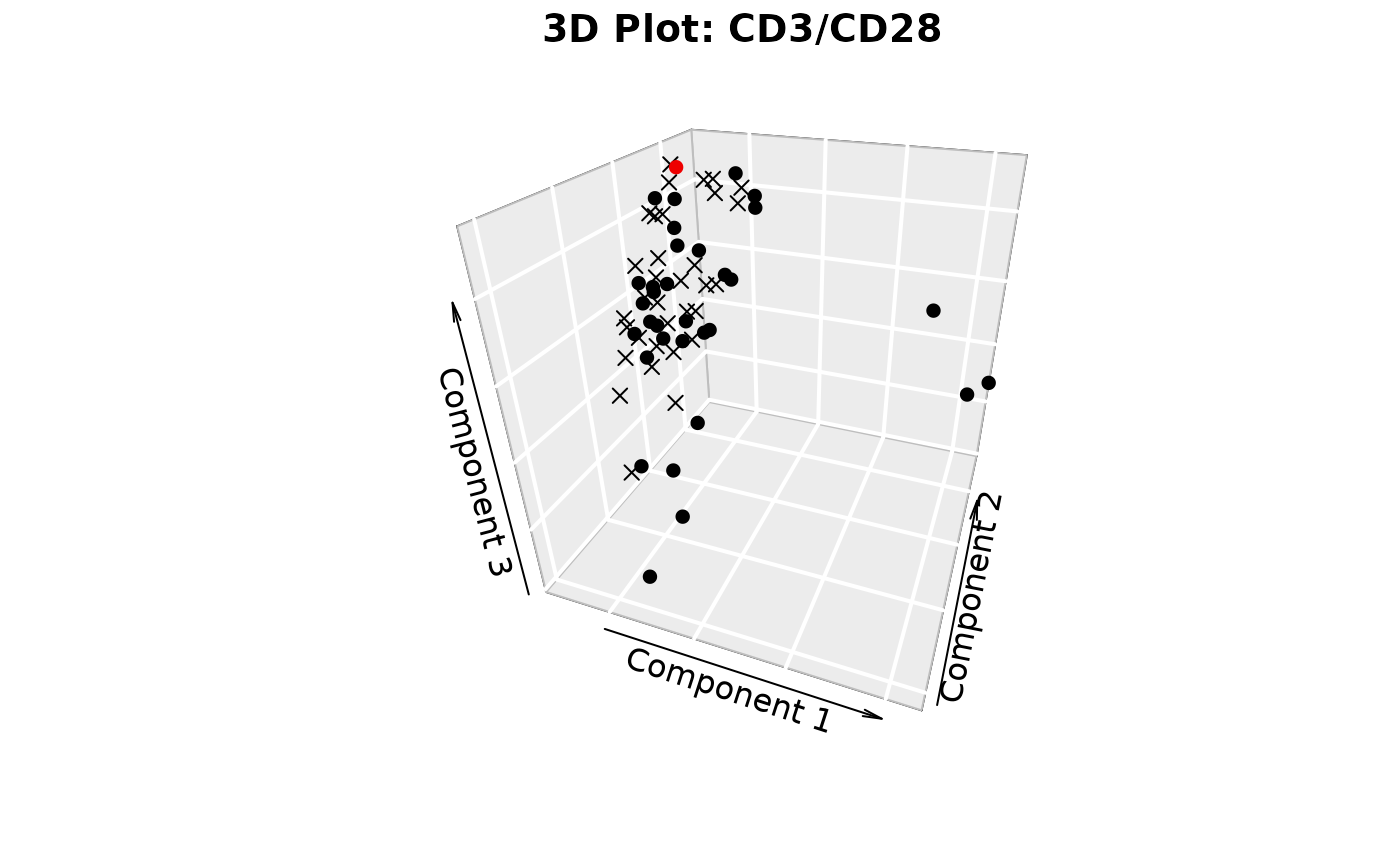
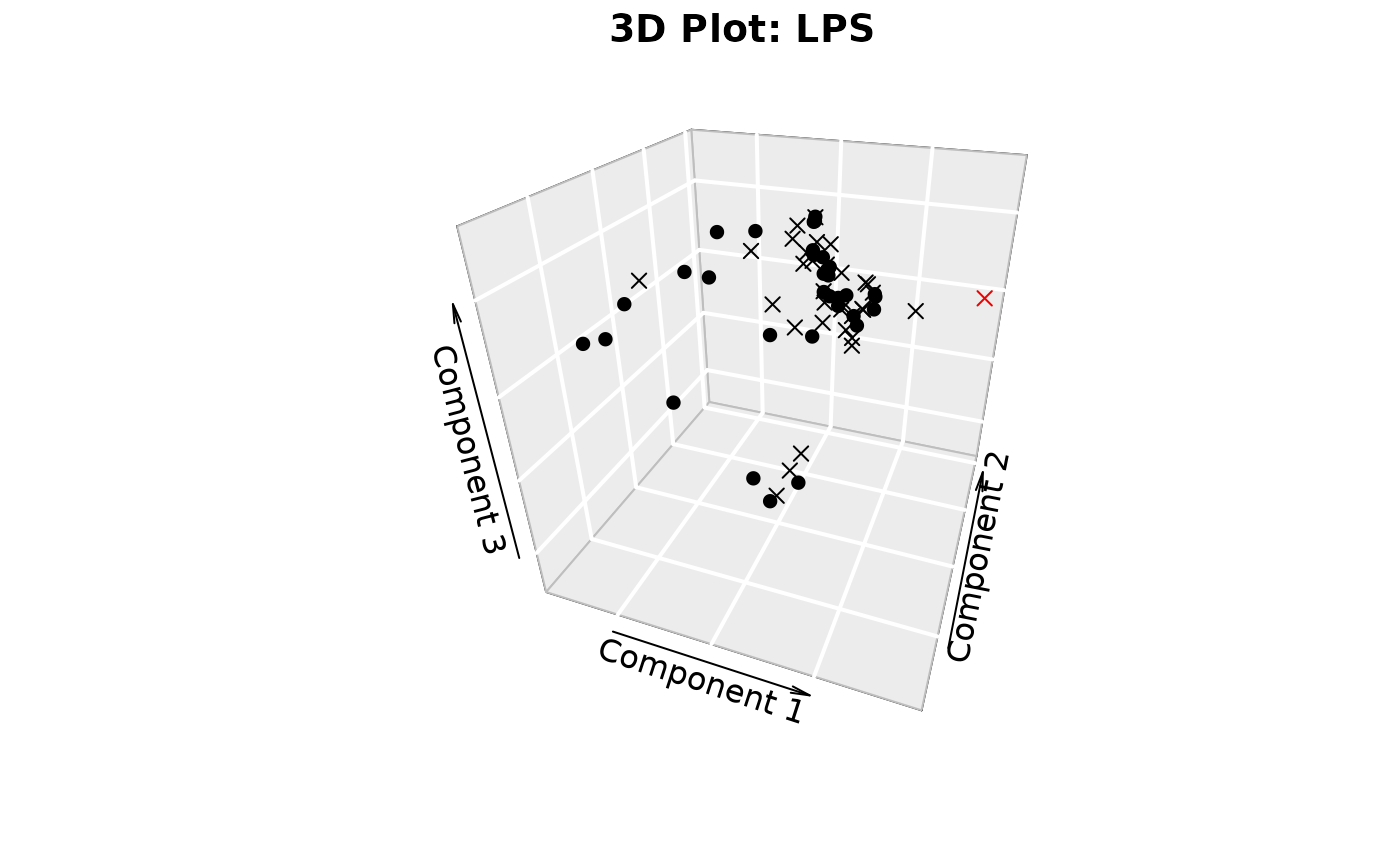
plotIndivfunction,3D scatter plots (if
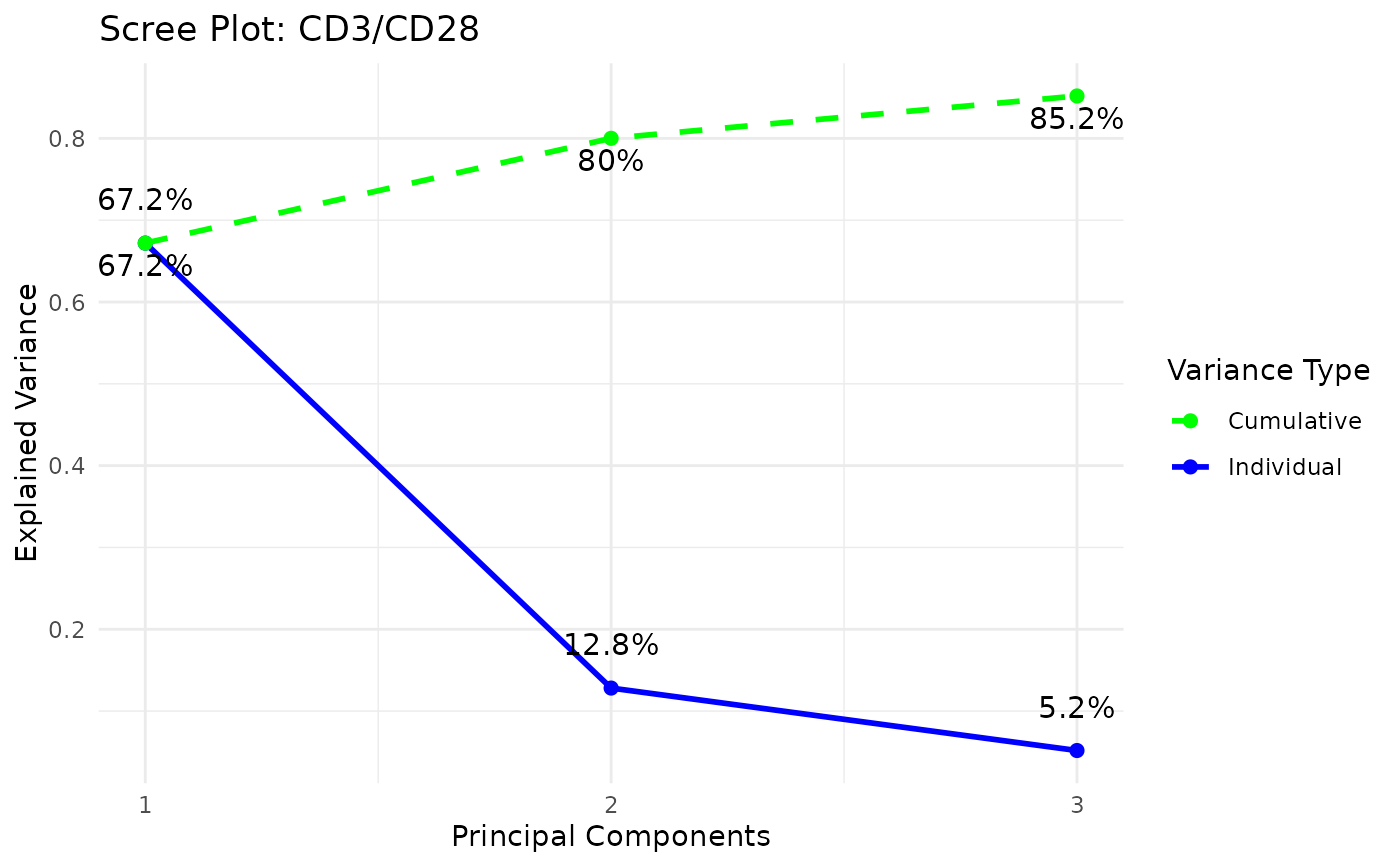
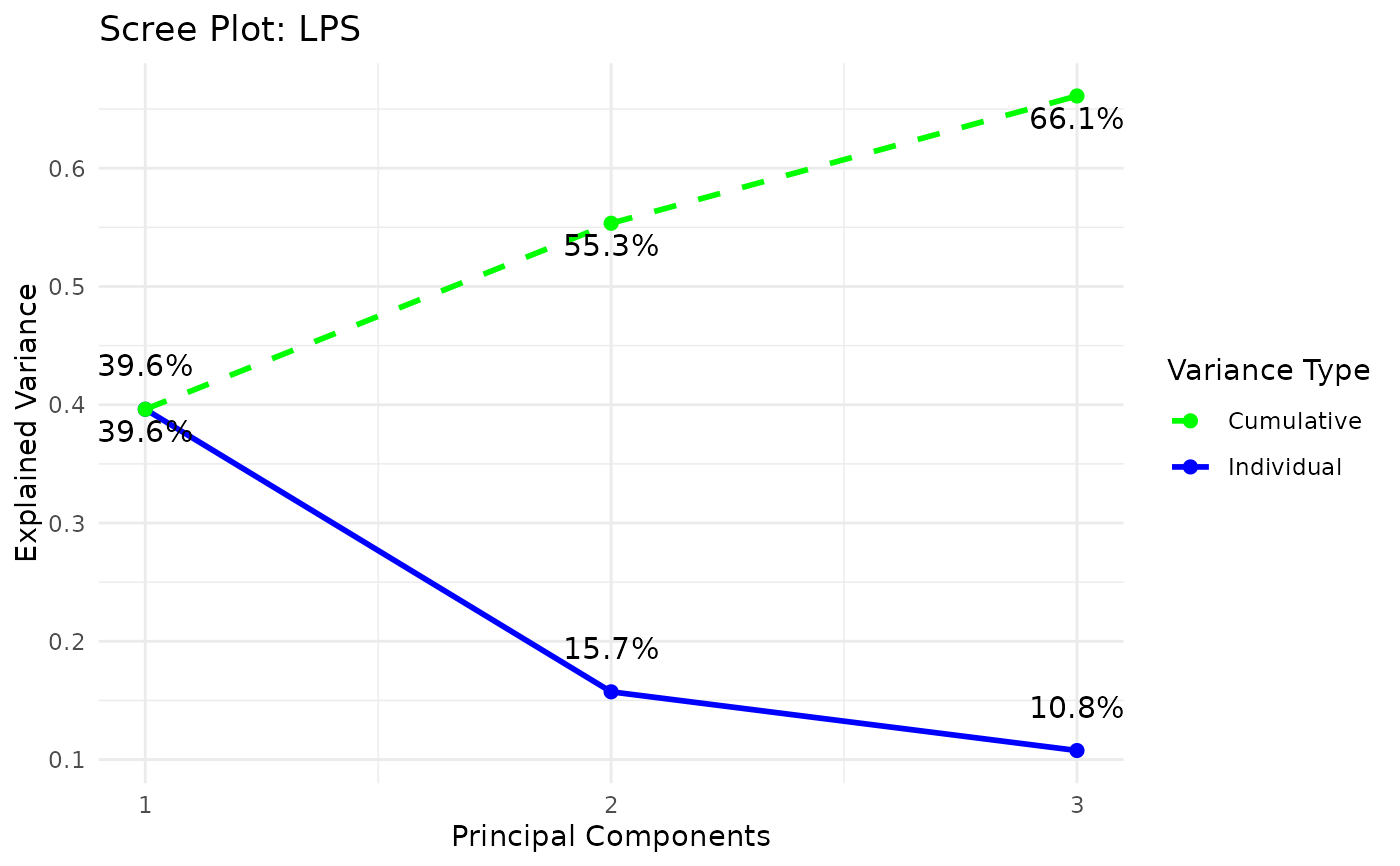
styleis "3d" or "3D" andcomp_numis 3) via the plot3D package,Scree plots showing both individual and cumulative explained variance,
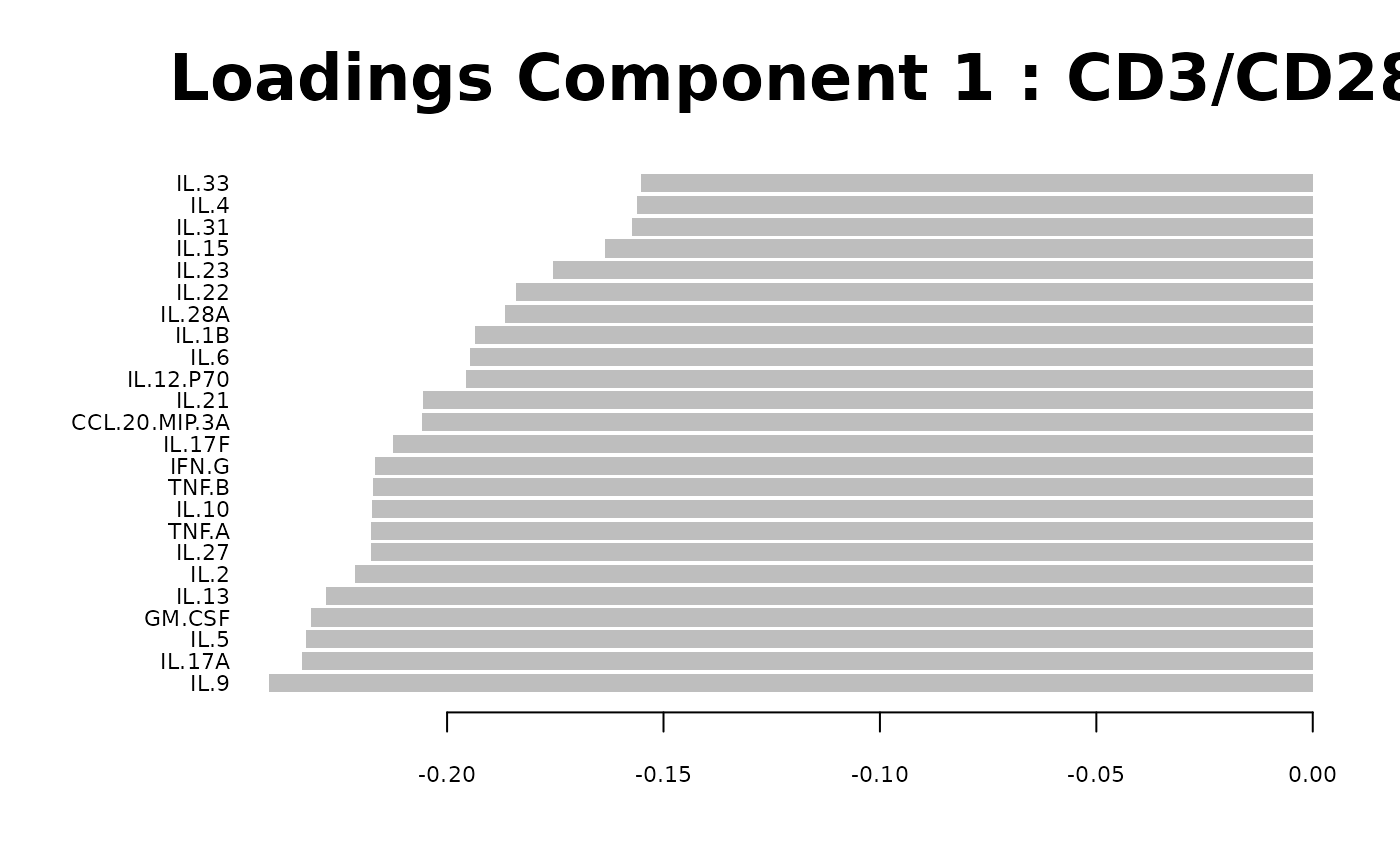
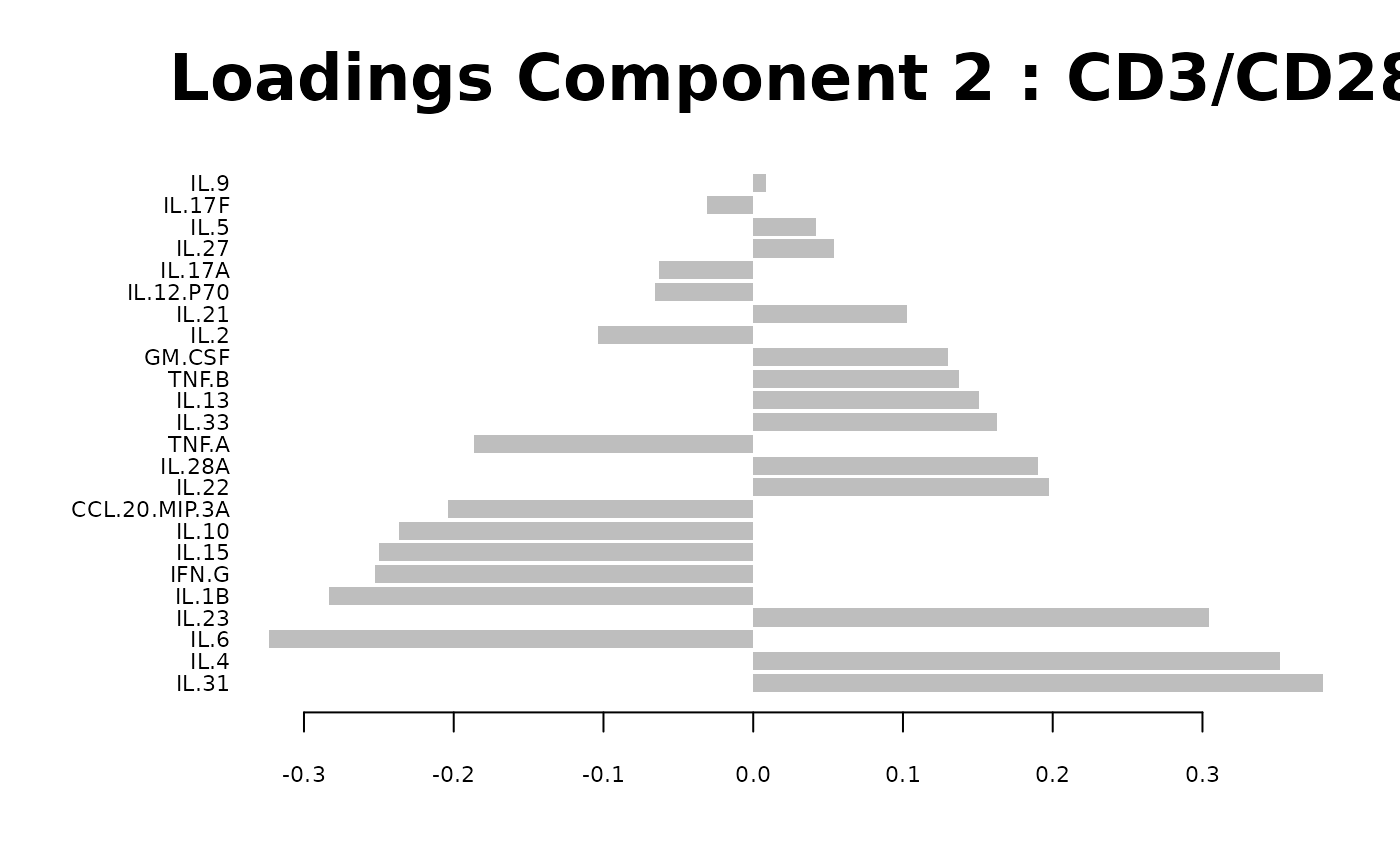
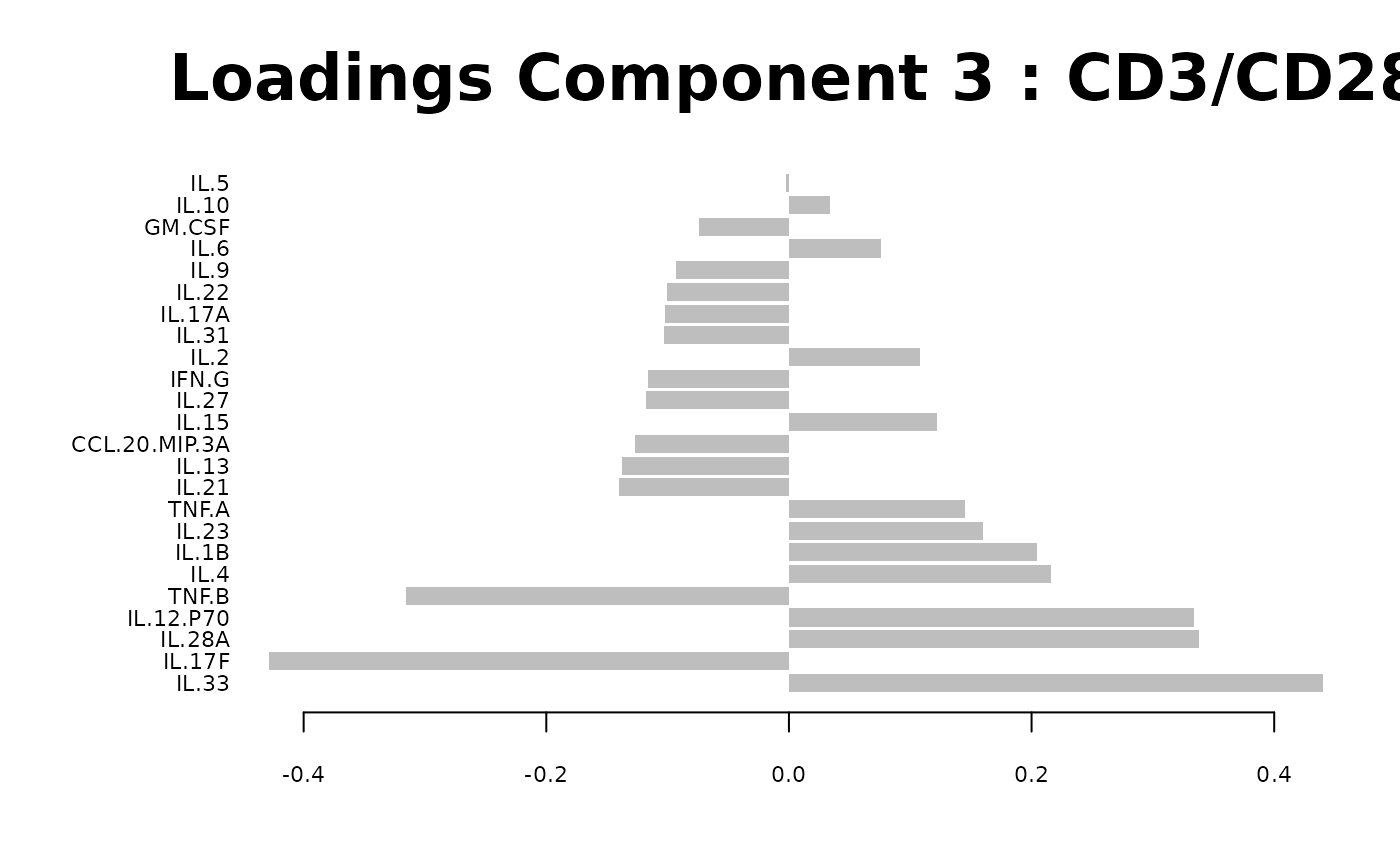
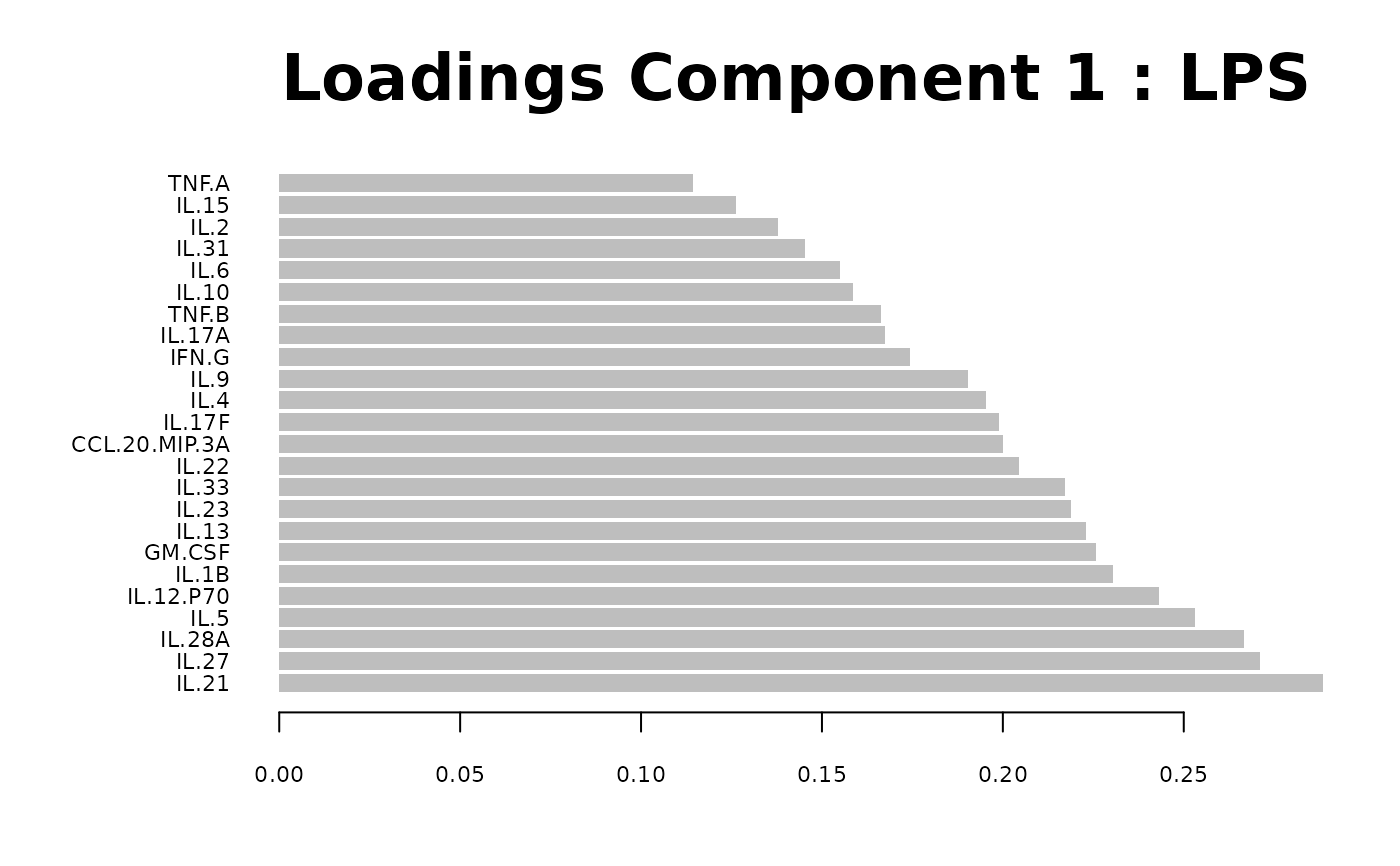
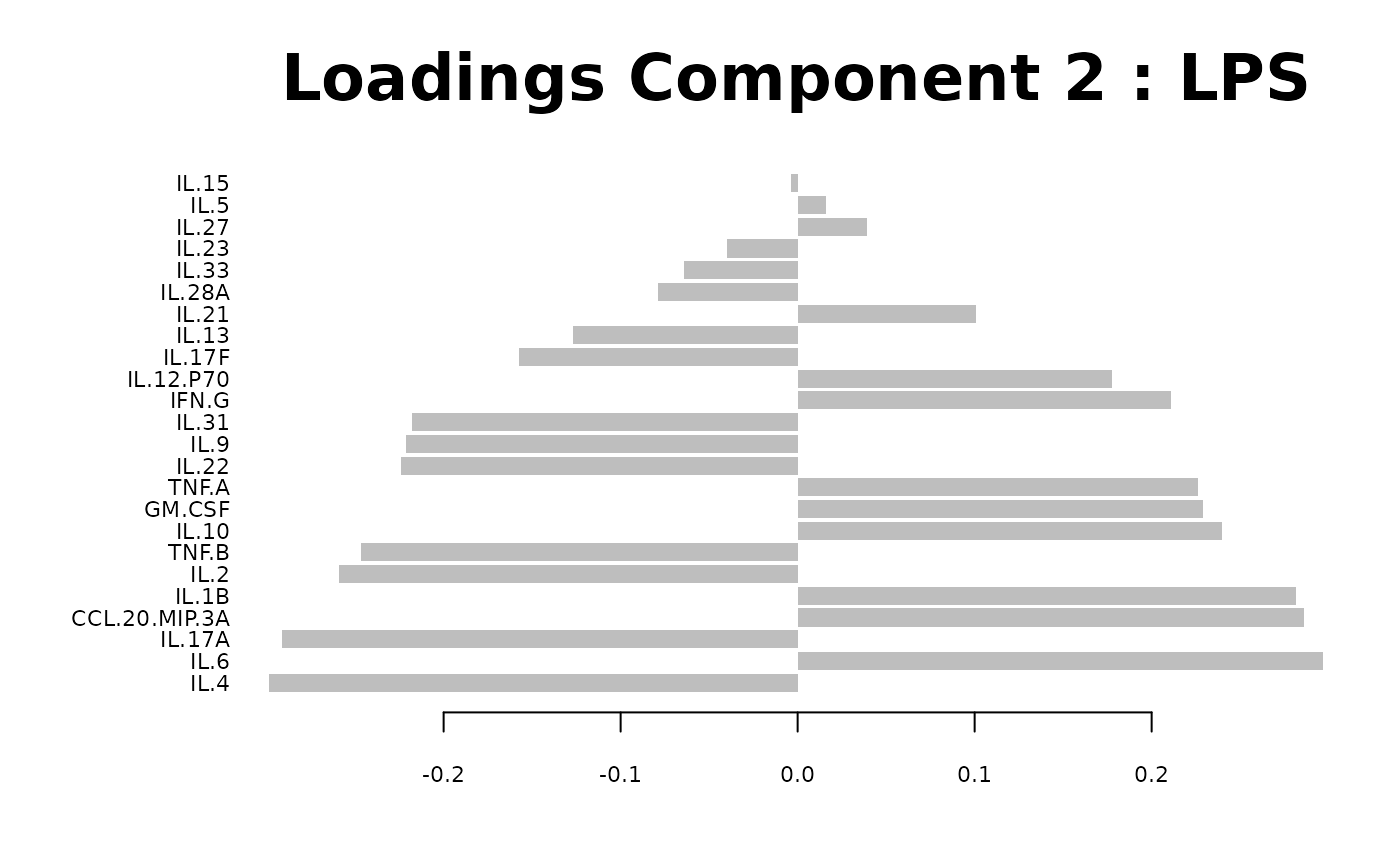
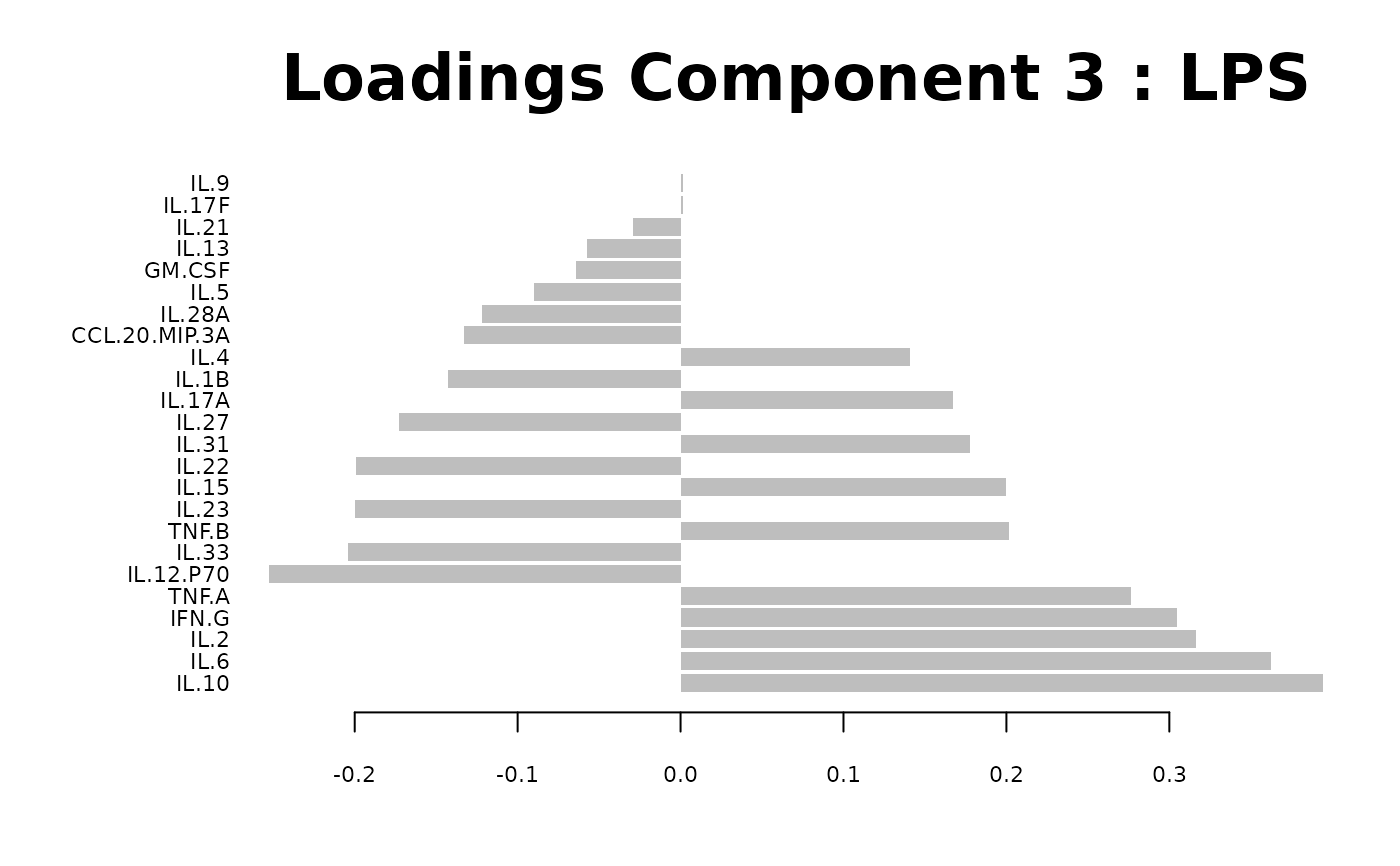
Loadings plots, and
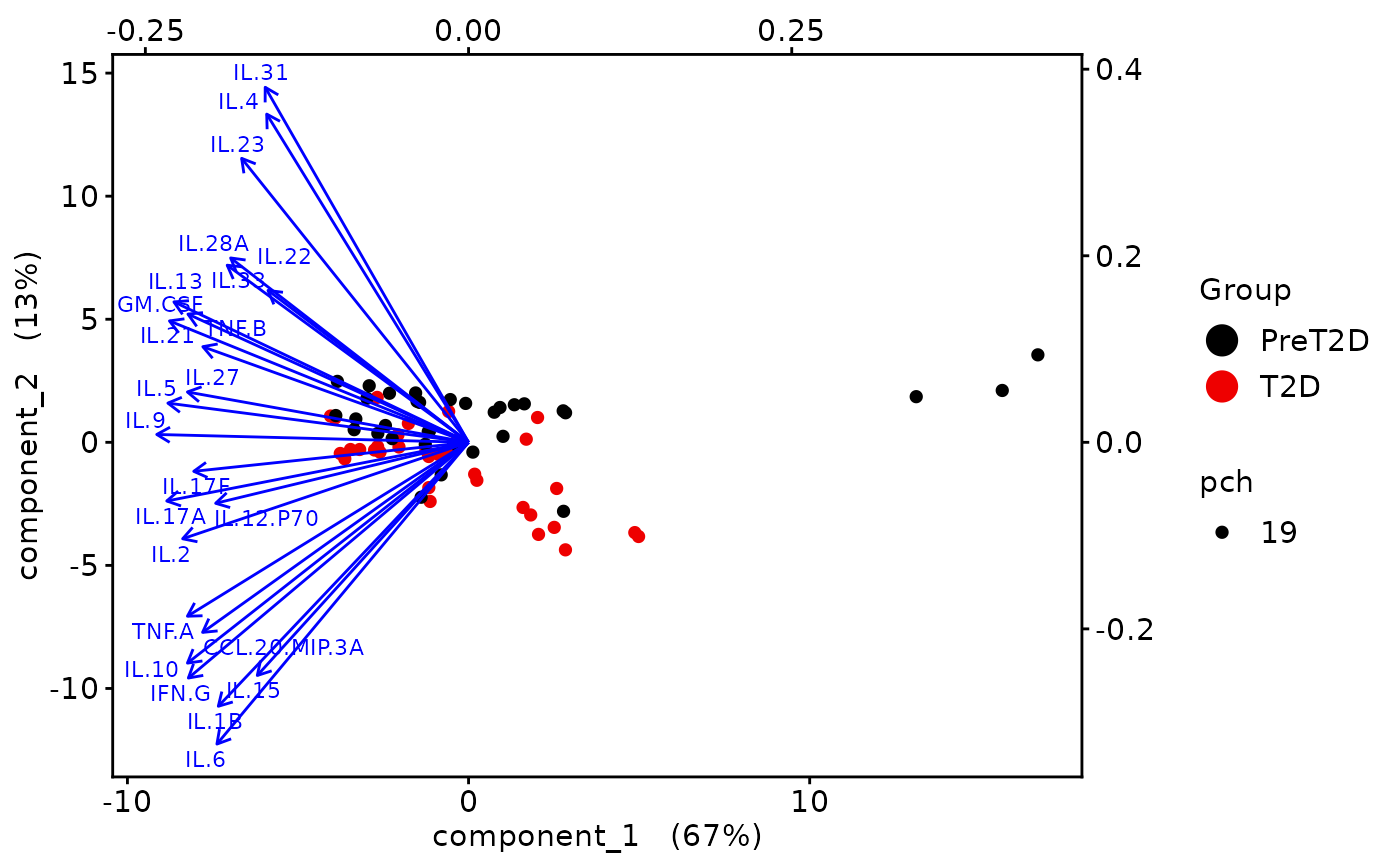
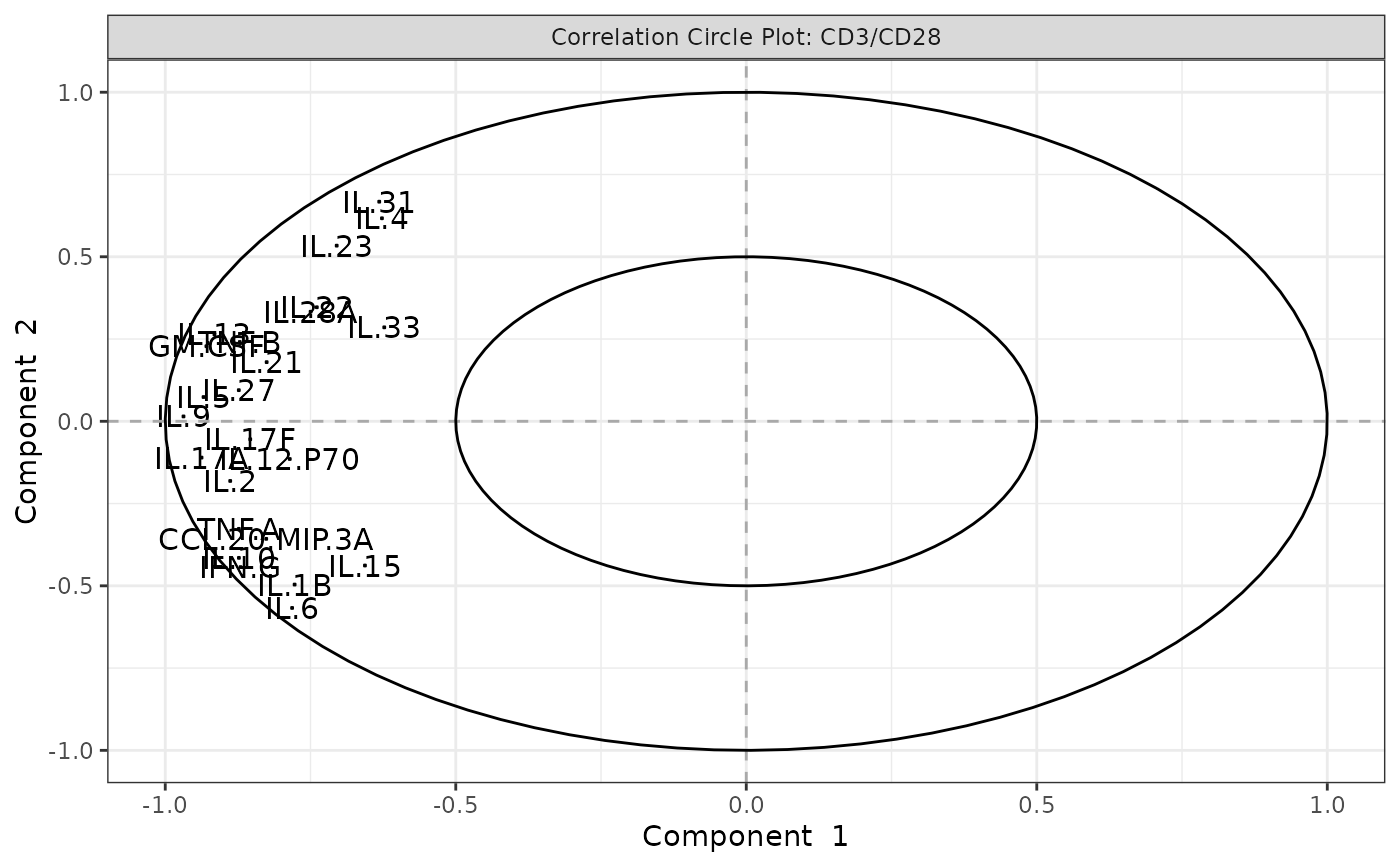
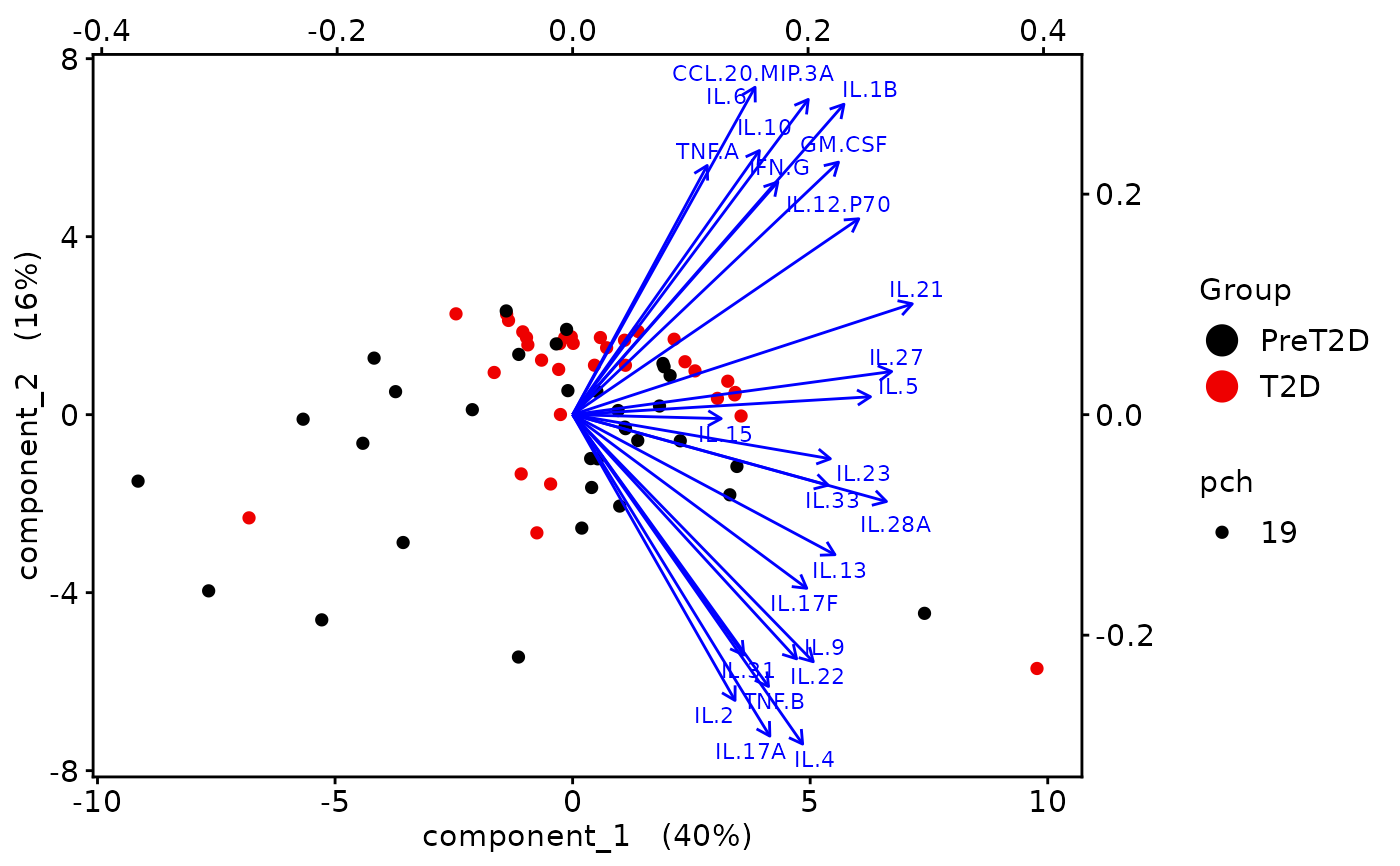
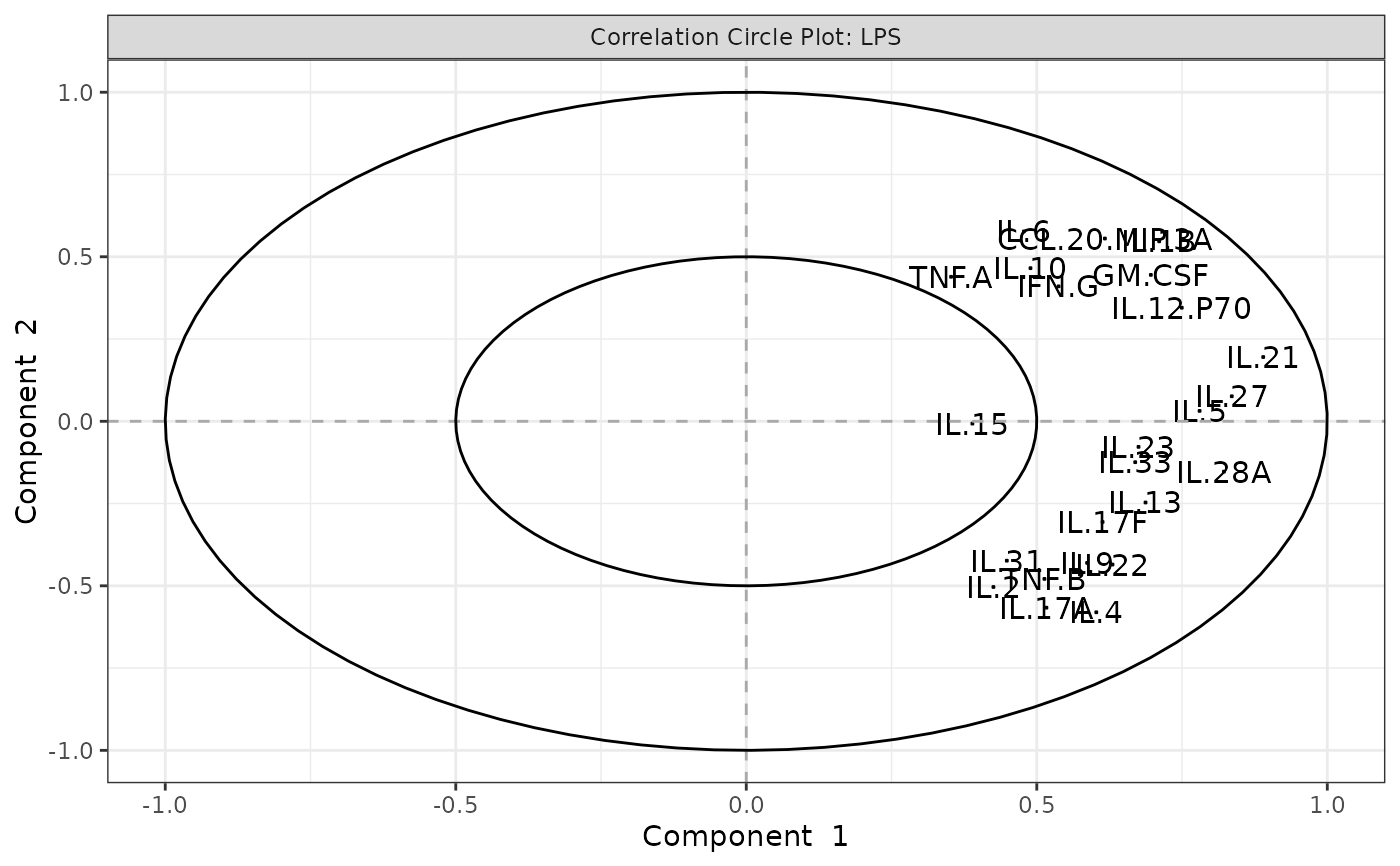
Biplots and correlation circle plots.
Usage
cyt_pca(
  data,
  group_col = NULL,
  group_col2 = NULL,
  colors = NULL,
  output_file,
  ellipse = FALSE,
  comp_num = 2,
  scale = c("none", "log2", "log10", "zscore", "custom"),
  custom_fn = NULL,
  pch_values = NULL,
  style = NULL
)
Arguments
- data
A data frame containing cytokine data. It should include at least one column representing grouping information and optionally a second column representing treatment or stimulation.
- group_col
A string specifying the column name that contains the first group information. If
group_col2is not provided, an overall analysis will be performed.- group_col2
A string specifying the second grouping column. Default is
NULL.- colors
A vector of colors corresponding to the groups. If set to NULL, a palette is generated using
rainbow()based on the number of unique groups.- output_file
Optional string specifying the name of the file to be created. When
NULL(default), plots are drawn on the current graphics device. Ensure that the file extension matches the desired format (e.g., ".pdf" for PDF output or ".png" for PNG output or .tiff for TIFF output).- ellipse
Logical. If TRUE, a 95% confidence ellipse is drawn on the PCA individuals plot. Default is FALSE.
- comp_num
Numeric. The number of principal components to compute and display. Default is 2.
- scale
Character string specifying a transformation to apply to numeric variables before PCA. Options are "none" (no transformation), "log2", "log10", "zscore", or "custom". When "custom" is selected, a user supplied function must be given via
custom_fn. Defaults to "none".- custom_fn
A custom function used when
scale = "custom". Should take a numeric vector and return a numeric vector. Ignored otherwise.- pch_values
A vector of plotting symbols (pch values) to be used in the PCA plots. Default is NULL.
- style
Character. If set to "3d" or "3D" and
comp_numequals 3, a 3D scatter plot is generated using the plot3D package. Default is NULL.
Value
A PDF file containing the PCA plots is generated and saved when
output_file is provided. Otherwise, plots are displayed on the current
graphics device.
Examples
# Load sample data
data <- ExampleData1[, -c(3,23)]
data_df <- dplyr::filter(data, Group != "ND" & Treatment != "Unstimulated")
# Run PCA analysis and save plots to a PDF file
cyt_pca(
  data = data_df,
  output_file = NULL,
  colors = c("black", "red2"),
  scale = "log2",
  comp_num = 3,
  pch_values = c(16, 4),
  style = "3D",
  group_col = "Group",
  group_col2 = "Treatment",
  ellipse = FALSE
)