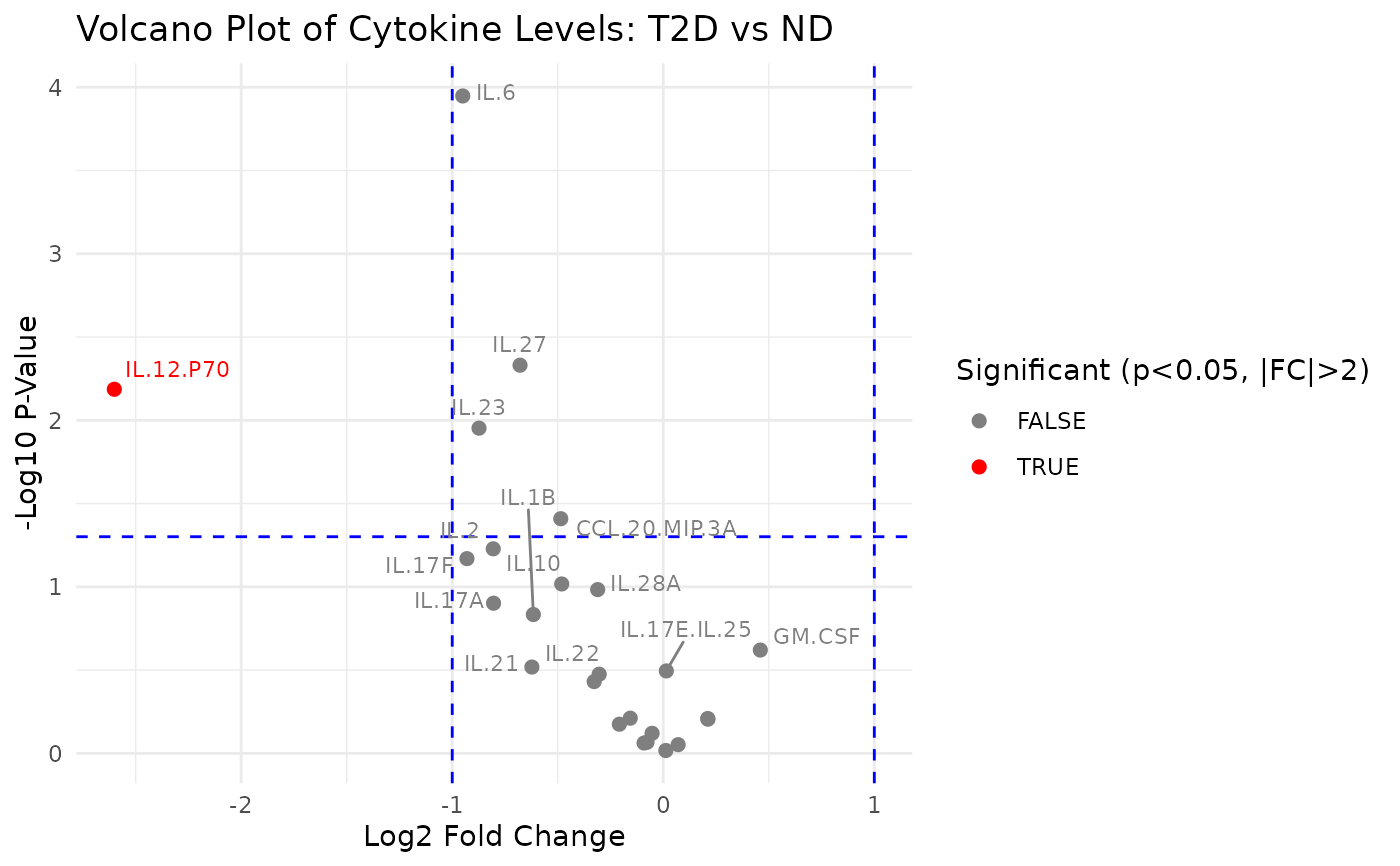
This function subsets the numeric columns from the input data and compares them based on a selected grouping column. It computes the fold changes (as the ratio of means) and associated p-values for each numeric variable between two groups. The results are log2-transformed (for fold change) and -log10-transformed (for p-values) to generate a volcano plot. Additionally, there is a choice between t‑tests and Wilcoxon rank‑sum tests and adjusting p‑values for multiple comparisons.
Usage
cyt_volc(
  data,
  group_col,
  cond1 = NULL,
  cond2 = NULL,
  fold_change_thresh = 2,
  p_value_thresh = 0.05,
  top_labels = 10,
  method = c("ttest", "wilcox"),
  p_adjust_method = NULL,
  add_effect = FALSE,
  verbose = FALSE
)
Arguments
- data
A data frame containing numeric variables and a grouping column.
- group_col
Character. Name of the grouping column.
- cond1
Character string specifying the level of
group_colfor the first condition to compare.- cond2
Character strings specifying the second level of
group_colto compare withcond1.- fold_change_thresh
Numeric. Threshold for absolute fold change (in original scale). Default is 2.
- p_value_thresh
Numeric. Threshold for the p‑value (raw or adjusted). Default is 0.05.
- top_labels
Integer. Number of top points to label in each plot. Default is 10.
- method
Character. Statistical test to use. "ttest" (default) uses two‑sample t‑tests; "wilcox" uses Wilcoxon rank‑sum tests.
- p_adjust_method
Character or
NULL. Method to adjust p‑values across variables within each comparison (e.g., "BH"). IfNULL(default) no adjustment is performed. Seep.adjustfor details.- add_effect
Logical. If
TRUE, effect sizes are computed and returned in the results (Cohen's d for t‑tests; rank‑biserial for Wilcoxon). Default isFALSE.- verbose
Logical. If
TRUE, prints the data frame used for the final comparison without the label column. Default isFALSE.
Value
A list of ggplot objects (one per comparison). Each plot
visualizes log2 fold change on the x‑axis and –log10 of the
(adjusted) p‑value on the y‑axis. The underlying data used to
construct the final plot are printed when verbose = TRUE.
Note
If cond1 and cond2 are not provided, the function
automatically generates all possible pairwise combinations of groups from
the specified group_col for comparisons.
Examples
# Loading data
data_df <- ExampleData1[,-c(2:3)]

cyt_volc(data_df, "Group", cond1 = "T2D", cond2 = "ND", fold_change_thresh = 2.0, top_labels= 15)
#> $`T2D vs ND`

#>
#>