Analyze data with Sparse Partial Least Squares Discriminant Analysis (sPLS-DA).
Source:R/cyt_splsda.R
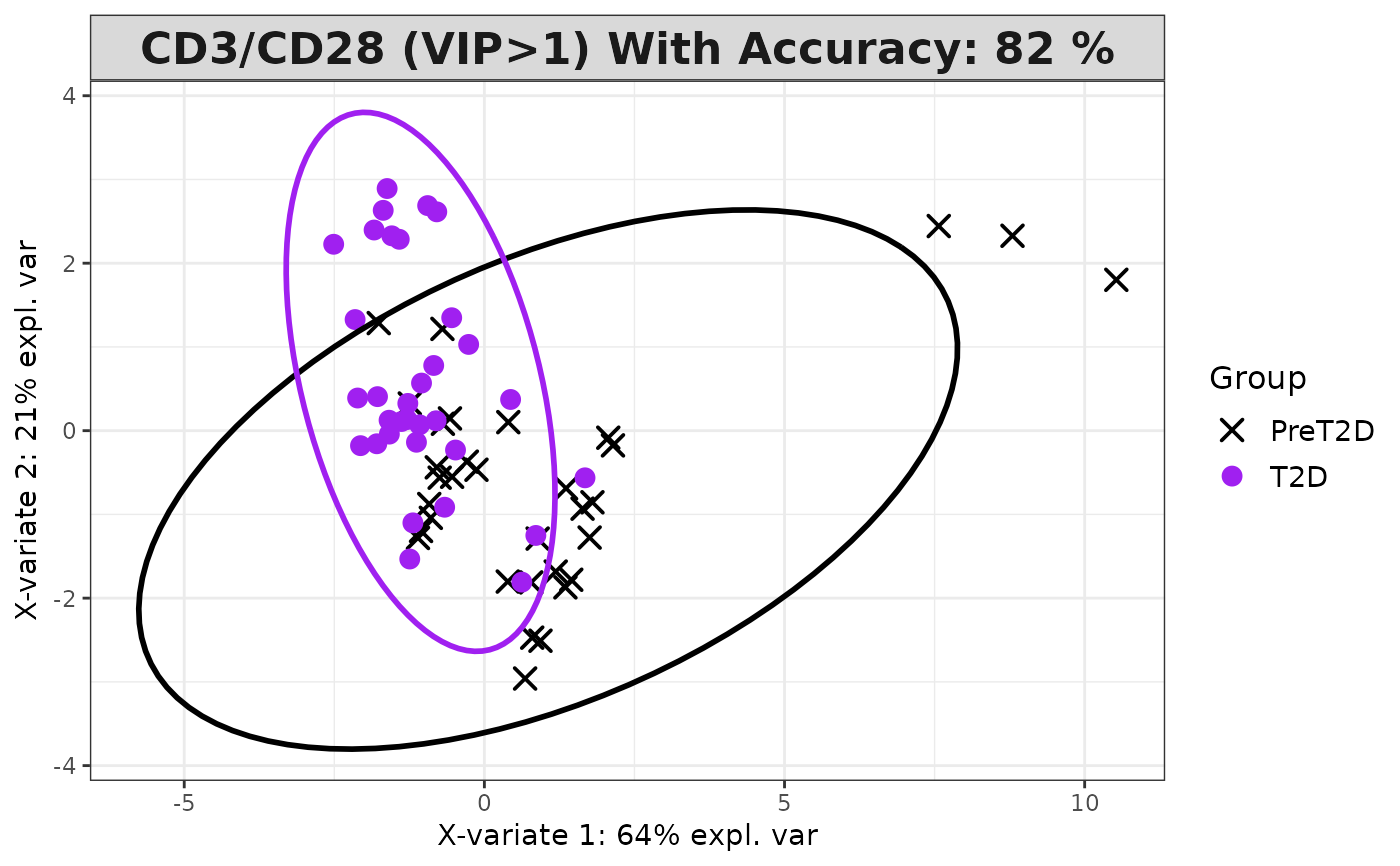
cyt_splsda.RdThis function conducts Sparse Partial Least Squares Discriminant Analysis
(sPLS-DA) on the provided data. It uses the specified group_col (and
optionally group_col2) to define class labels while assuming the remaining
columns contain continuous variables. The function supports transformations
via the scale parameter and generates a series of plots,
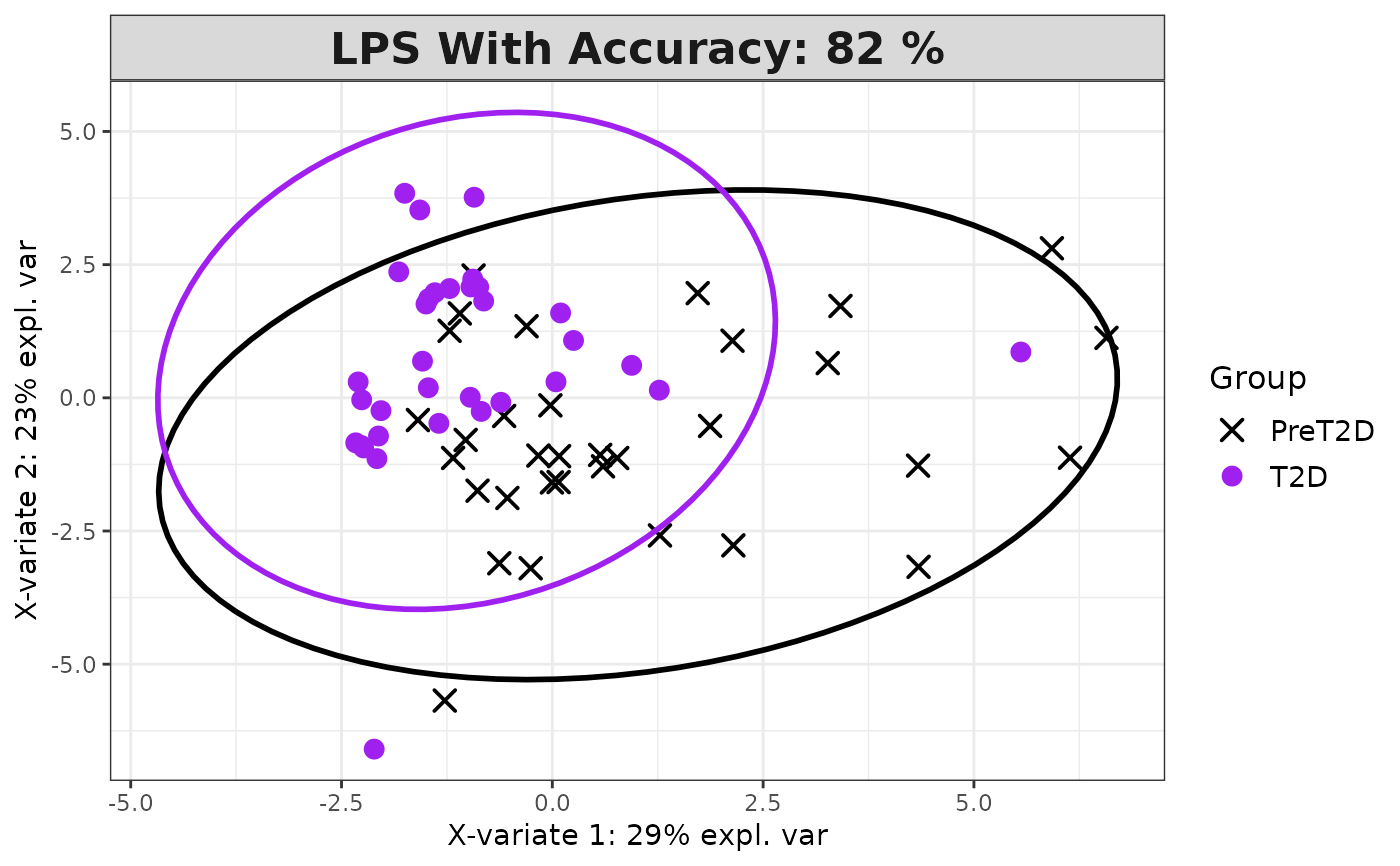
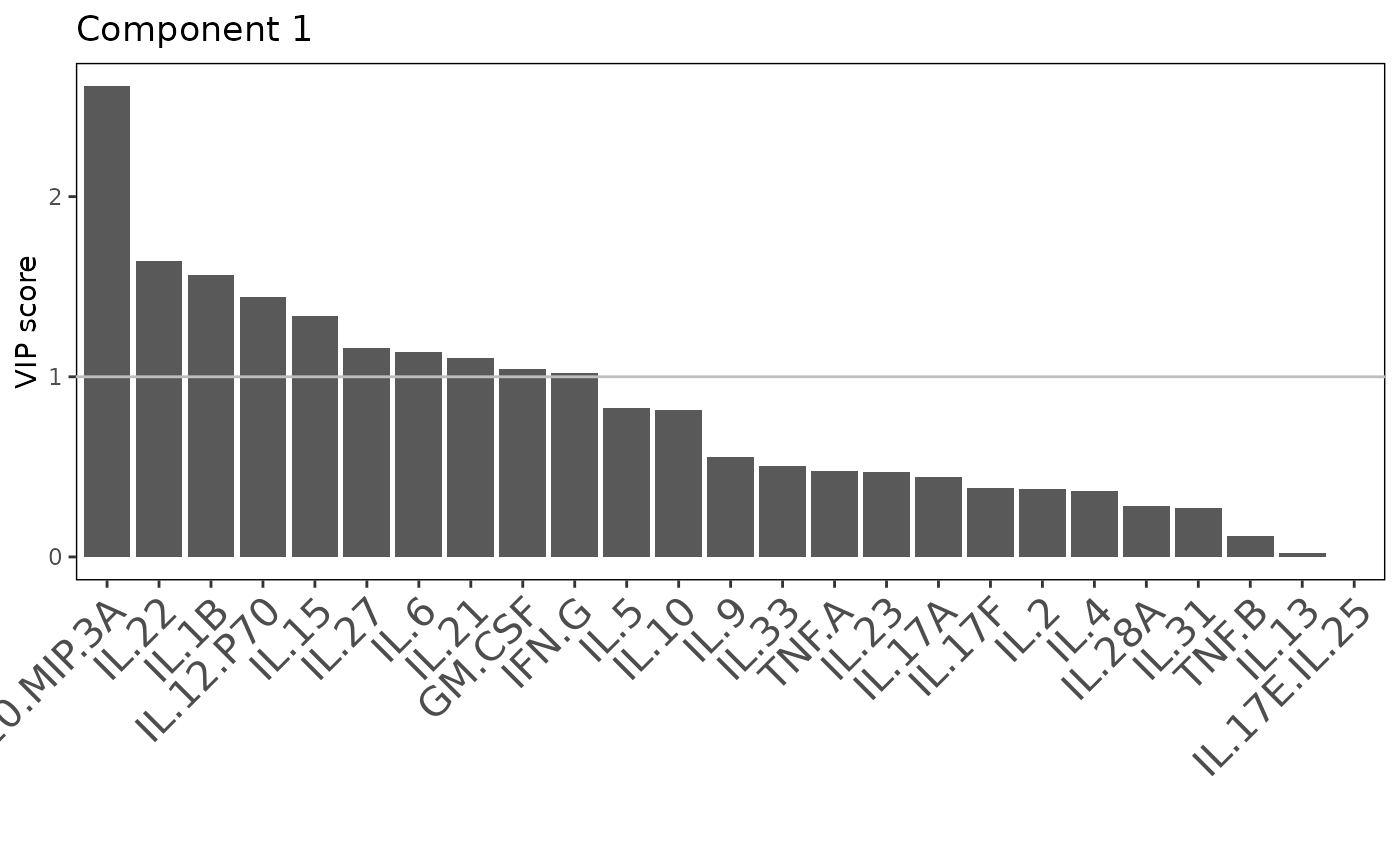
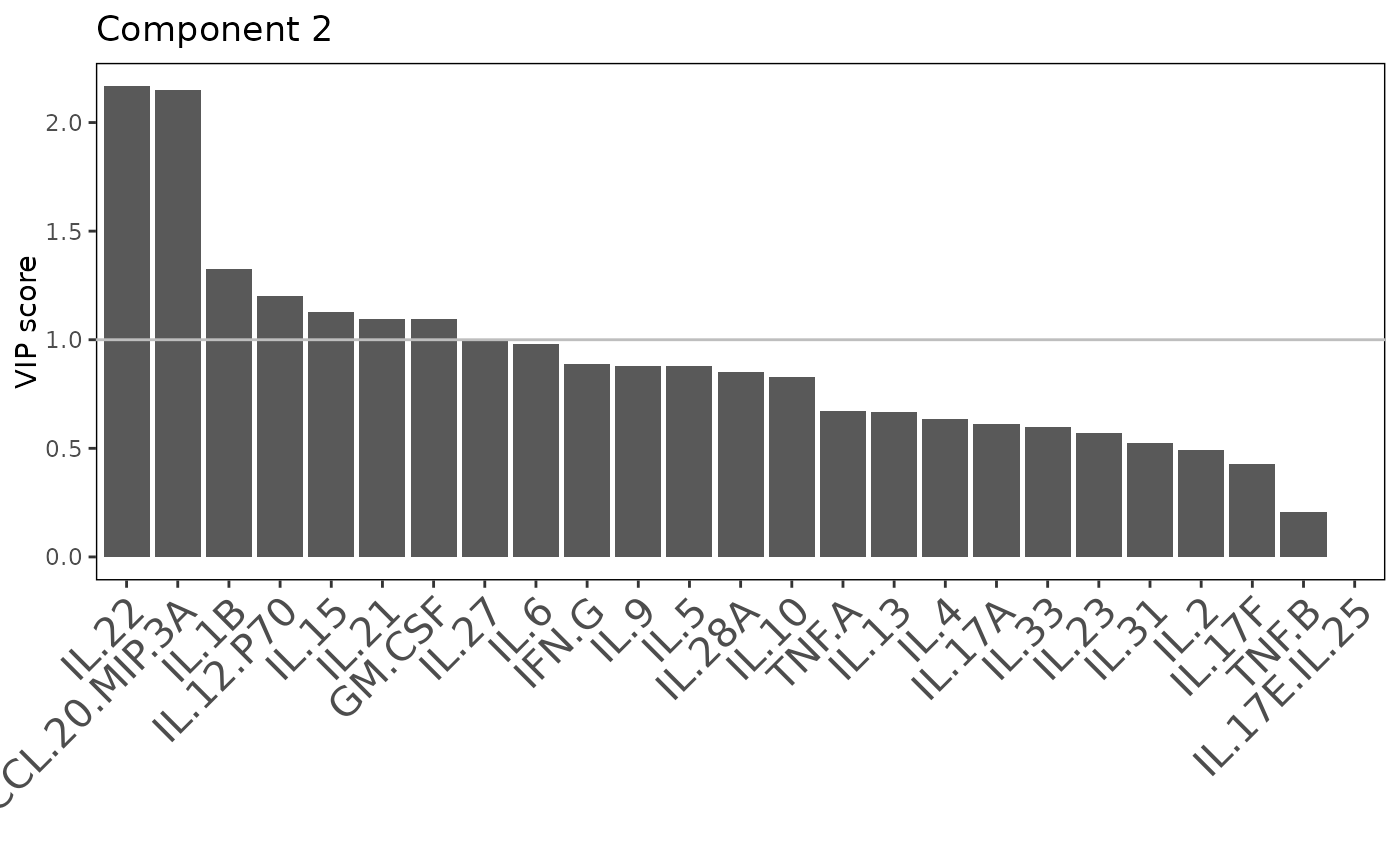
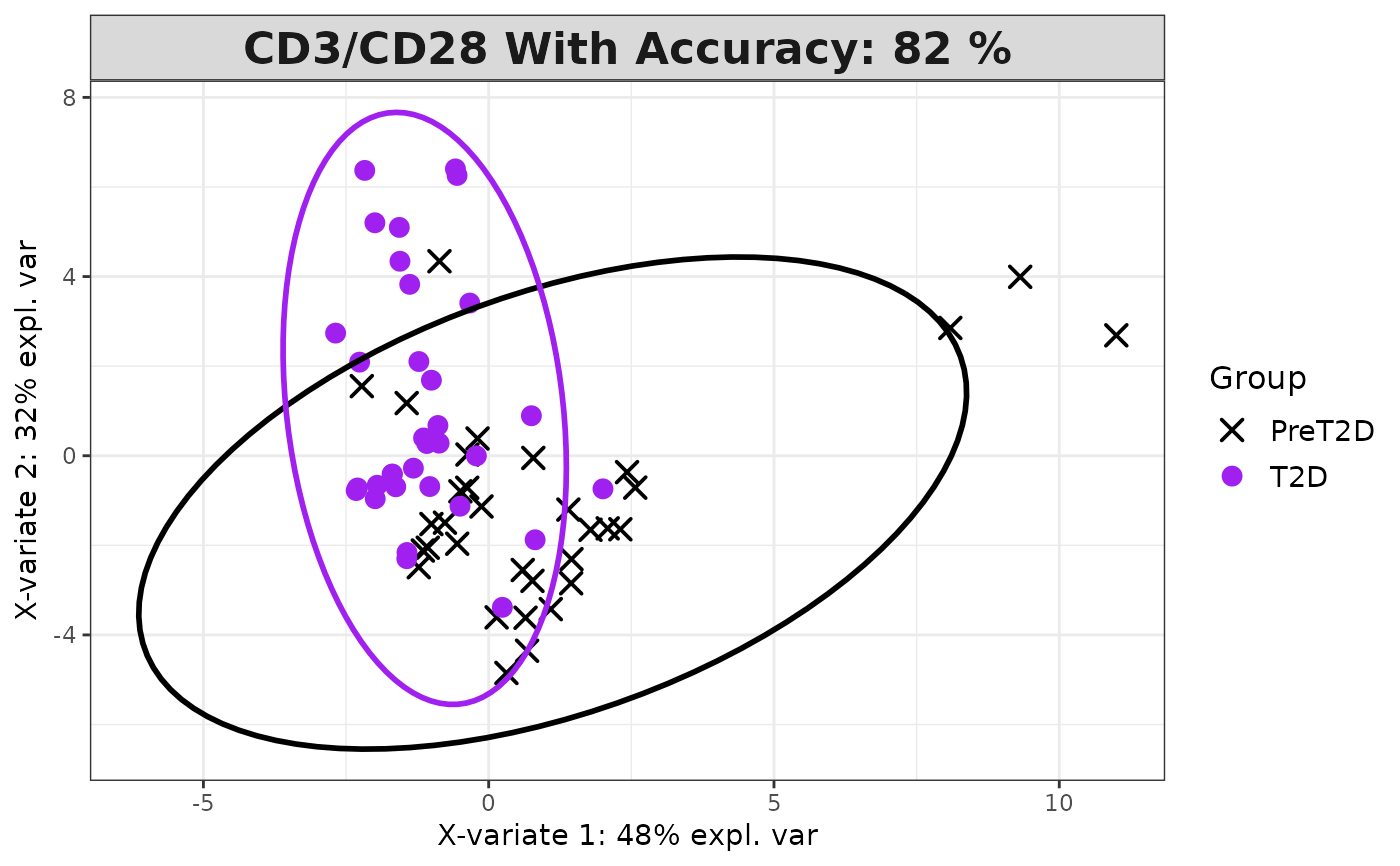
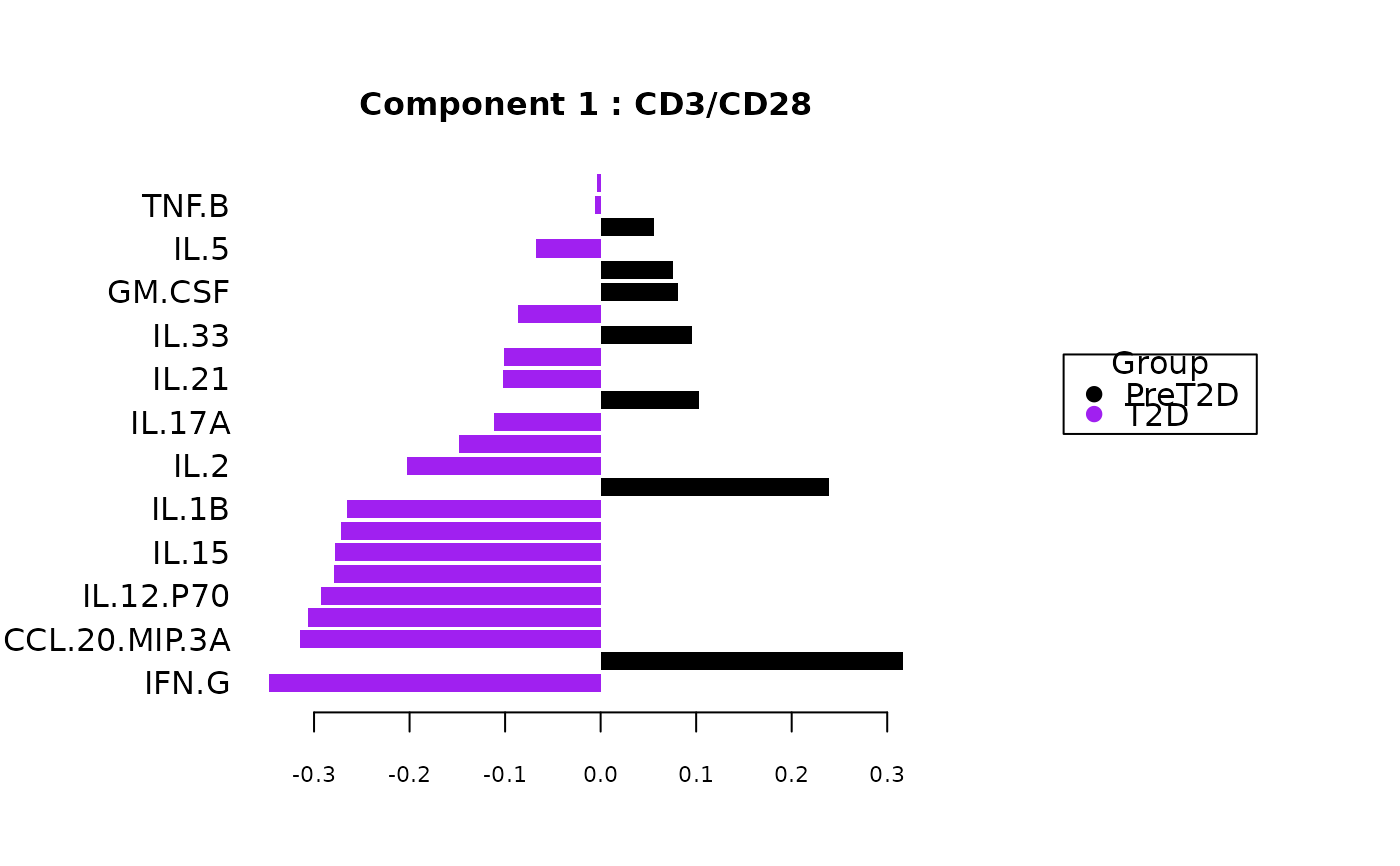
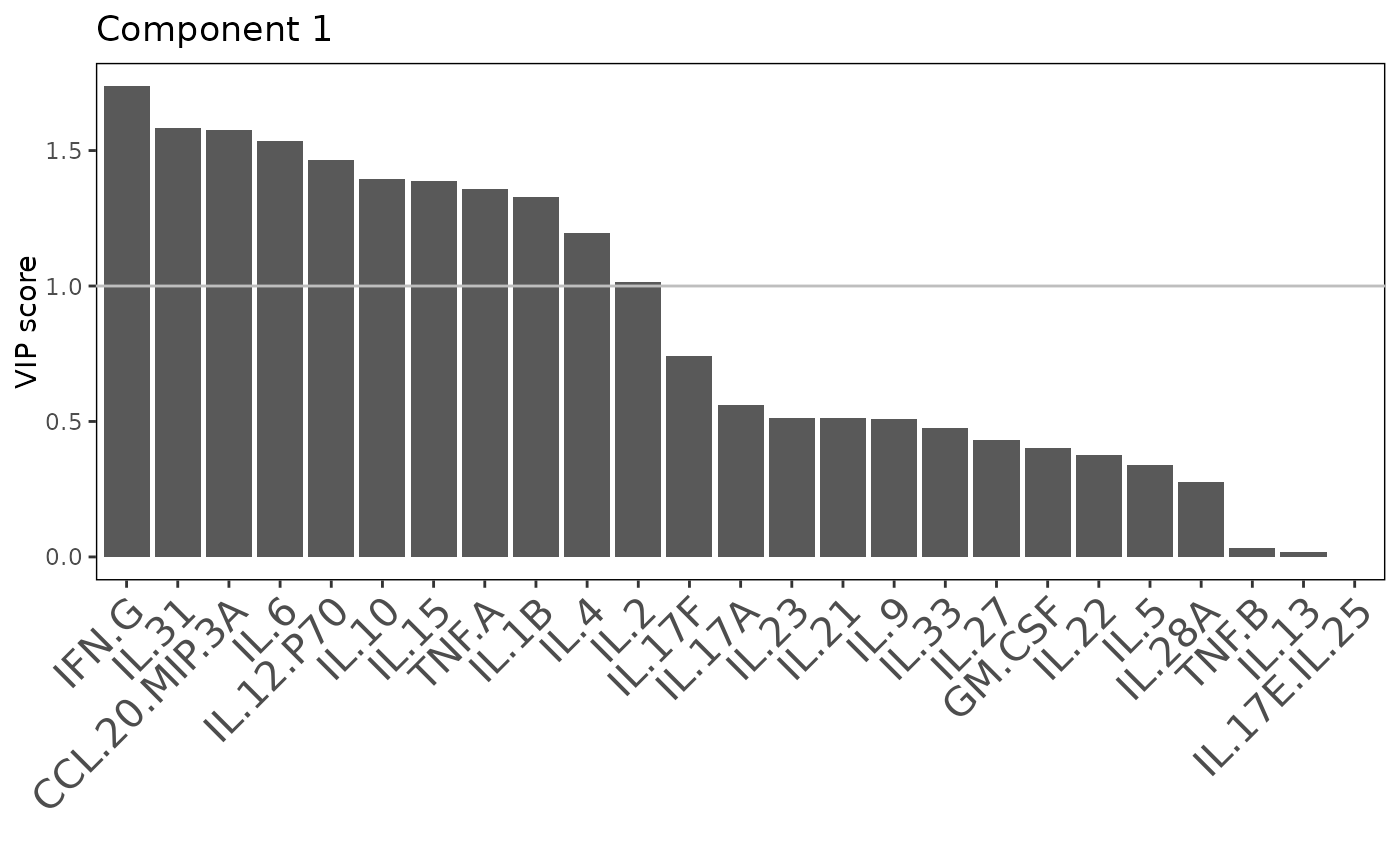
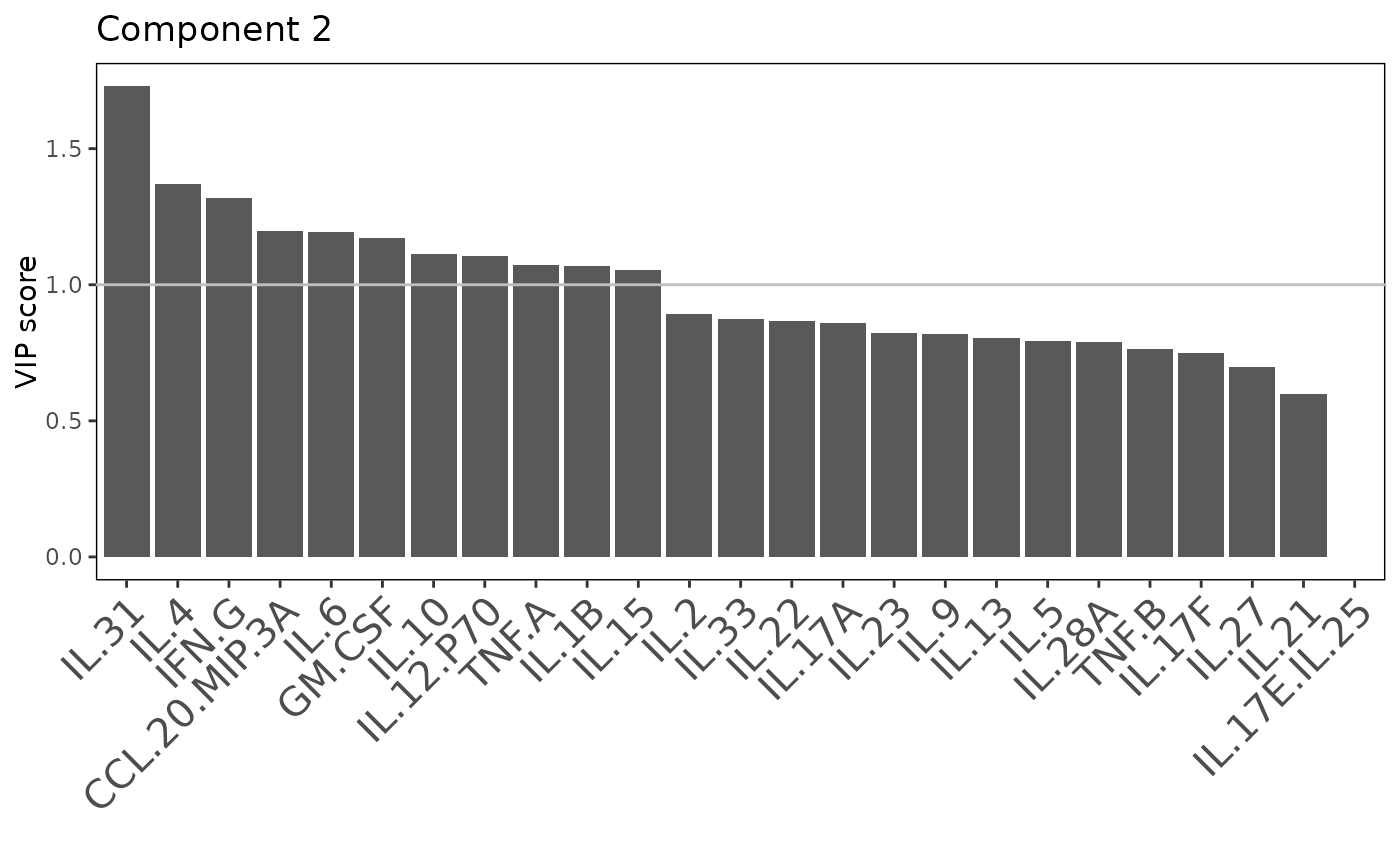
including classification plots, scree plots, loadings plots, and VIP score
plots. Optionally, ROC curves are produced when roc is TRUE.
Additionally, cross-validation is supported via LOOCV or Mfold methods. When
both group_col and group_col2 are provided and differ, the function
analyzes each treatment level separately.
Usage
cyt_splsda(
  data,
  group_col = NULL,
  group_col2 = NULL,
  multilevel_col = NULL,
  batch_col = NULL,
  ind_names = FALSE,
  colors = NULL,
  output_file = NULL,
  ellipse = FALSE,
  bg = FALSE,
  conf_mat = FALSE,
  var_num,
  cv_opt = NULL,
  fold_num = 5,
  scale = c("none", "log2", "log10", "zscore", "custom"),
  custom_fn = NULL,
  tune = FALSE,
  tune_folds = 5,
  comp_num = 2,
  pch_values,
  style = NULL,
  roc = FALSE,
  verbose = FALSE,
  seed = 123
)
Arguments
- data
A matrix or data frame containing the variables. Columns not specified by
group_colorgroup_col2are assumed to be continuous variables for analysis.- group_col
A string specifying the column name that contains the first group information. If
group_col2is not provided, an overall analysis will be performed.- group_col2
A string specifying the second grouping column. Default is
NULL.- multilevel_col
A string specifying the column name that identifies repeated measurements (e.g., patient or sample IDs). If provided, a multilevel analysis will be performed. Default is
NULL.- batch_col
A string specifying the column that identifies the batch or study for each sample.
- ind_names
If
TRUE, the row names of the first (or second) data matrix is used as names. Default isFALSE. If a character vector is provided, these values will be used as names. If 'pch' is set this will overwrite the names as shapes. See ?mixOmics::plotIndiv for details.- colors
A vector of colors for the groups or treatments. If
NULL, a random palette (usingrainbow) is generated based on the number of groups.- output_file
Optional string specifying the name of the file to be created. When
NULL(default), plots are drawn on the current graphics device. Ensure that the file extension matches the desired format (e.g., ".pdf" for PDF output or ".png" for PNG output or .tiff for TIFF output).- ellipse
Logical. Whether to draw a 95\ figures. Default is
FALSE.- bg
Logical. Whether to draw the prediction background in the figures. Default is
FALSE.- conf_mat
Logical. Whether to print the confusion matrix for the classifications. Default is
FALSE.- var_num
Numeric. The number of variables to be used in the PLS-DA model.
- cv_opt
Character. Option for cross-validation method: either "loocv" or "Mfold". Default is
NULL.- fold_num
Numeric. The number of folds to use if
cv_optis "Mfold". Default is 5.- scale
Character string specifying a transformation to apply to the numeric predictor columns prior to model fitting. Options are "none", "log2", "log10", "zscore", or "custom". When "custom" is selected a user defined function must be supplied via
custom_fn. Defaults to "none".- custom_fn
A custom transformation function used when
scale = "custom". Ignored otherwise. It should take a numeric vector and return a numeric vector of the same length.- tune
Logical. If
TRUE, performs tuning ofncompandkeepXvia cross‑validation. Default isFALSE.- tune_folds
Integer. Number of folds in cross‑validation when tuning. Default is 5.
- comp_num
Numeric. The number of components to calculate in the sPLS-DA model. Default is 2.
- pch_values
A vector of integers specifying the plotting characters (pch values) to be used in the plots.
- style
Character. If set to
"3D"or"3d"andcomp_numequals 3, a 3D plot is generated using theplot3Dpackage. Default isNULL.- roc
Logical. Whether to compute and plot the ROC curve for the model. Default is
FALSE.- verbose
A logical value indicating whether to print additional informational output to the console. When
TRUE, the function will display progress messages, and intermediate results whenFALSE(the default), it runs quietly.- seed
An integer specifying the seed for reproducibility (default is 123).
Value
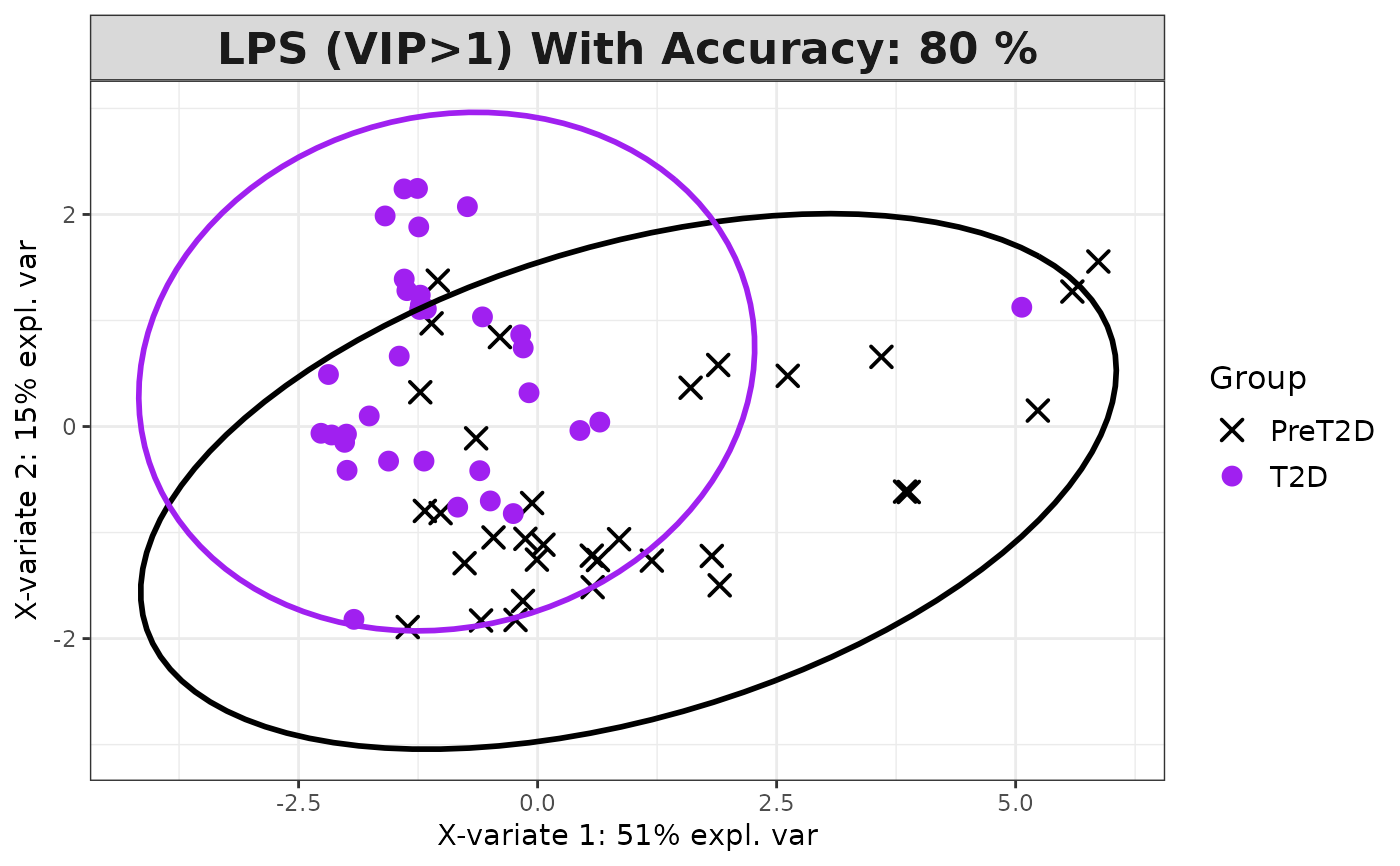
Plots consisting of the classification figures, component figures with Variable of Importance in Projection (VIP) scores, and classifications based on VIP scores greater than 1. ROC curves and confusion matrices are also produced if requested.
Details
When verbose is set to TRUE, additional information about the analysis and confusion matrices
are printed to the console. These can be suppressed by keeping verbose = FALSE.
References
Lê Cao, K.-A., Boitard, S. and Besse, P. (2011). Sparse PLS Discriminant Analysis: biologically relevant feature selection and graphical displays for multiclass problems. BMC Bioinformatics 12:253.
Examples
# Loading Sample Data
data_df <- ExampleData1[,-c(3)]
data_df <- dplyr::filter(data_df, Group != "ND", Treatment != "Unstimulated")

cyt_splsda(data_df, output_file = NULL,
colors = c("black", "purple"), bg = FALSE, scale = "log2",
conf_mat = FALSE, var_num = 25, cv_opt = NULL, comp_num = 2,
pch_values = c(16, 4), style = NULL, ellipse = TRUE,
group_col = "Group", group_col2 = "Treatment", roc = FALSE, verbose = FALSE)
#> Warning: the standard deviation is zero


#> Warning: the standard deviation is zero